Most serving benchmarks hold the request rate and the length distribution fixed and print one number, whereas production traffic does neither, and it decides your bill through a different mechanism than the one the benchmark measured.
This post works through a 70B open-weights model on H100 80GB nodes at about $2.50 per GPU-hour, served by vLLM v0.25.1. Everything below hangs on one quantity you can compute before measuring anything: the arithmetic intensity where an H100 stops being memory-bound, 295 FLOP per byte. One measurement turns that into 183 positions per step, and 183 sets the batch size where throughput stops improving, the batch size where speculative decoding turns negative, and the floor under the chunked-prefill token budget.
Two notes on the stack before any of it, because both changed recently enough to invalidate a lot of written advice. V0 was removed entirely in v0.11.0, so V1 is the only engine and preemption is recompute-only, and prefix caching is on by default, which changes what a preemption costs.
The number everything else hangs on
The ridge of the roofline is peak compute over peak bandwidth. An H100 SXM moves 3.35 TB/s and does 989 dense BF16 TFLOP/s, half the 1,979 the datasheet quotes with sparsity, since attention and MLP GEMMs are dense.
A forward pass over T positions does about 2PT FLOPs and reads the weights
once, P·s bytes at s bytes per parameter, so intensity is 2T/s and the
crossover sits at T = s·peak/(2·BW). FP8 doubles the ridge and halves the bytes
per parameter, so both precisions land on the same position count. It lands
differently on the two halves of a request: a batch of 64 decodes puts 64
positions in the step and sits to the left, where the weight read dominates and
the marginal sequence is close to free, whereas a 1,377-token prompt arrives all
at once and sits 7.5x to the right, where every token costs real FLOPs.
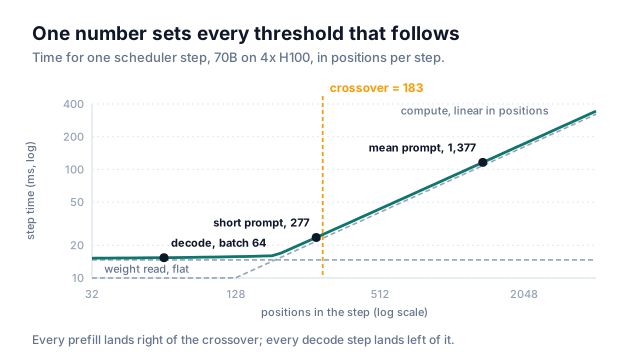
That 295 is FLOP per byte while the step in front of you is measured in positions, and treating the two as one number is the quiet error in most write-ups of this, my own first notes included. They coincide only if you hit peak FLOPs and peak bandwidth at once, which nobody does, so converting between them costs the ratio of the two efficiencies. Compute efficiency runs well below memory efficiency on this shape, so the operational crossover lands lower:
That falls out of the step timings directly: a weight read takes about 15.4 ms and compute runs at about 11.9 positions per ms, so the two meet at 183. Every threshold below derives from 183, and none of them from 295. The distinction is not pedantic: a threshold set at 295 positions is conservative when it guards latency, and wrong in the dangerous direction when it asserts you are still memory-bound.
This matters more than it looks because of the length mixture. Our traffic is 70% short turns and 30% long-context work, and sampling that mixture gives a mean of 1,377 input tokens against 272 output tokens, so prefill is 84% of the FLOPs the node does. A mix this shape is not decode-heavy, and tuning it as if decode were scarce sends you after the wrong knobs, because every failure below happens where a compute-bound prefill and a memory-bound decode land in the same step.
Two latencies wearing one name
Time to first token and inter-token latency answer to different resources, so a single end-to-end p95 hides both of them at once. At our base rate of 4 requests per second the node runs a batch of about 16, which is 97 positions, left of the crossover, so the step is a weight read at 14.3 ms regardless of how many sequences are in it, or 70 tokens per second per stream. TTFT is one chunked prefill plus one step of admission wait: 132 ms for an average prompt, 361 ms for a 3,944-token one.
A 2.5 second p95 target is comfortable against those numbers, but applied end to end it is not a target at all. The p95 of the output-length mixture is 1,079 tokens, and 1,079 tokens at 14.3 ms is 15.5 seconds of decode before you add the prefill, rising to 36 seconds when the node is saturated. An end-to-end SLO of 2.5 seconds is wrong here by six to fourteen times, and it will read as a capacity problem forever.
| Metric | Base load | Saturated | Two-minute burst |
|---|---|---|---|
| TTFT, mean prompt | 132 ms | 154 ms | up to 65 s |
| ITL | 14.3 ms | 33.0 ms | 33.0 ms |
| TPOT p95 | 14.9 ms | 34.3 ms | 34.3 ms |
| End-to-end at p95 output length | 15.5 s | 35.6 s | 101 s |
The burst multiplies TTFT by more than four hundred and ITL by 2.3, because queueing lands entirely on TTFT while batch pressure and preemption land on ITL and TPOT. Reported separately, a “latency is up” page becomes a question with one of two answers.
Sizing the running batch
Steady state fills each step with B decode tokens and about 5.1B prefill
positions, since the mix runs 1,377 in against 272 out, so B(1+r) = 183 puts the
whole step at the crossover, at a running batch of 30. Below that the node pays a
full weight read for a step that does not use it, and above it the step is
compute-bound and grows linearly with B, so the node produces proportionally
more tokens in proportionally more time.
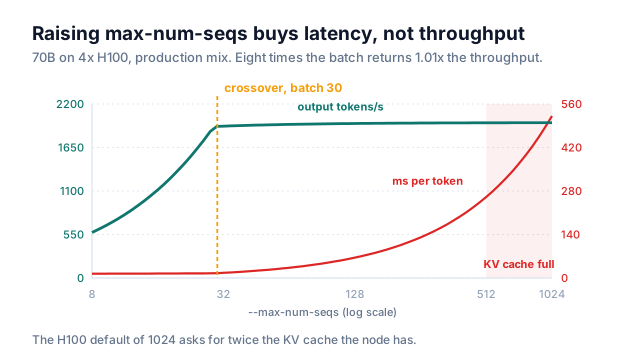
Going from a batch of 64 to a batch of 512 is eight times the concurrency for
1.01x the throughput and eight times the inter-token latency, which makes
--max-num-seqs a latency control that has been widely documented as a throughput
control. It is also, without saying so, the KV cache admission limit, since it
counts admitted requests, with no regard for whether they are decoding, so a long
prompt occupies a slot and holds its blocks through every step of its prefill
while producing nothing. After weights and activations, a TP=4 node at the default
--gpu-memory-utilization of 0.92 has 138 GB of KV pool, which is 845,000 tokens
at fp8. A long-context request holding a 3,944-token prompt and a 754-token answer
occupies about 4,700 of them, so the node preempts somewhere past 180 concurrent
long-context sequences. The
H100 default for --max-num-seqs is 1024,
which is 5.7 times past that point, and the scheduler knob and the memory budget
are set in different places by different people, with nothing in either one
mentioning the other.
There is a third owner of the same number.
--max-cudagraph-capture-size defaults to twice --max-num-seqs,
capped at 512, so the value that sets your inter-token latency and your preemption
point also sets how many CUDA graphs are captured at boot, which is startup time
and capture memory. Three subsystems read it, and none of their documentation
mentions the other two.
The same arithmetic gives the floor under the chunked-prefill token budget,
which
V1 enables by default.
--max-num-batched-tokens caps positions per step, and every running stream waits
out the whole step, so the budget is the worst-case inter-token gap. At the API
server’s H100 default of 8192 that gap is 688 ms, at 2048 it is 172 ms, and at 512
it is 43 ms, where prefilling a 3,944-token prompt in eight chunks instead of one
costs 3.9% throughput, because 512 positions is still comfortably right of the
crossover. The control stops paying below about 183, where a chunk no longer
amortizes the weight read it triggers.
What the budget bounds is the step, and not any one request’s share of it. Under
the default fcfs policy the scheduler fills the budget in arrival order, so one
3,944-token prompt takes the whole 2,048-token budget for consecutive steps and
every other stream in the batch eats back-to-back worst-case gaps for a request
that is not theirs. --scheduling-policy priority does not fix it. Priority
orders admission from the waiting queue, but says nothing about splitting the
budget among requests already admitted. The knob that splits it is
--long-prefill-token-threshold, documented as defaulting to 0, meaning no cap,
and it picks up a non-zero default only if you also raise the partial-prefill
limit, a V0-era knob the V1 scheduler no longer enforces for anything else. So the
default charges a long prompt to everyone in the batch except the tenant who sent
it, and nothing on the server can attribute it: the series carry a model name and
an engine index and no client identity at all.
Preemption, and what prefix caching gives back
Under KV pressure V1 preempts by recompute, and since the swap path and the
--swap-space flag are gone, the two-mode tuning discussion that used to apply
here has no config surface left.
Reading the scheduler is worth the five minutes, because three details change the shape of the problem. Under the default policy the evicted request is the one most recently added to the running list, which is neither the largest nor the oldest, and which on this mix means it is most often a request still working through its prefill chunks. Preemption then sets the request’s computed-token count to zero and puts it at the front of the waiting queue, so nothing about its progress survives in the request itself. And a step that preempts anything admits nothing. The waiting queue is skipped entirely for that iteration.
What survives is in the block pool. Prefix caching defaults to on, and a resumed request looks its blocks up again across prompt and generated tokens alike, so in the good case only the uncached tail is recomputed. Plus the final token, which has to run to produce the logits the request resumes from. The catch is timing. Preemption happens precisely when the cache is under pressure, which is precisely when freed blocks are most likely to be reclaimed for someone else, so the recovery cost is decided after the eviction, by whether anyone else needed those blocks in the interval. Recompute is best-effort, and its worst case is a full re-prefill: at 4.2% of requests preempted, that is 14% more prefill work on a node whose prefill was already 84% of the budget.
There is a second claim on the same pool, and the two are never discussed together. A block goes back on the free queue only once no request still references it, and that queue is the whole evictable set, so what pressure reclaims is always a cached block nobody is holding: the shared prefixes. One pool does two jobs, recovery for preempted requests and prefix sharing for new arrivals, with no way to reserve a share for either, which means TTFT under load is not purely a queueing story. A prompt that hit the cache while the node was calm re-prefills from further back once the node is busy, so prefill work per arrival grows at the moment the queue is longest, and the two multiply rather than add.
The third scheduler detail closes that loop, and it breaks the tidy split I drew two sections ago. Queueing lands on TTFT and batch pressure lands on ITL, but preemption lands on both, because every preemption is also an iteration in which nobody is admitted. The two latencies are coupled through the block pool, and the coupling only appears under the pressure that makes it matter.
None of this is visible in a latency graph until it is severe, so read it off the
server, where two naming details will cost you an afternoon. The metric is
vllm:kv_cache_usage_perc, and vllm:gpu_cache_usage_perc does not exist
anywhere in the tree, while vllm:num_requests_waiting is a strict prefix of
vllm:num_requests_waiting_by_reason, whose reasons sum to the same total, so a
startswith test silently reports double.
import re, requests

WANTED = ("vllm:num_requests_running", "vllm:num_requests_waiting",
          "vllm:kv_cache_usage_perc", "vllm:num_preemptions_total")
SAMPLE = re.compile(r"^(?P<name>[a-zA-Z_:][\w:]*)(?P<labels>\{[^}]*\})?\s+(?P<value>\S+)$")

def scrape(base="http://localhost:8000", engine="0"):
    """Counters are registered as vllm:num_preemptions and scraped with a
    _total suffix. Every series carries model_name and engine labels, so a
    multi-engine deployment returns one line per engine per metric."""
    out = {}
    for line in requests.get(f"{base}/metrics").text.splitlines():
        m = None if line.startswith("#") else SAMPLE.match(line)
        if not m or m["name"] not in WANTED:
            continue
        labels = dict(re.findall(r'(\w+)="([^"]*)"', m["labels"] or ""))
        if labels.get("engine", engine) != engine:
            continue
        out[m["name"]] = float(m["value"])
    return out

# mid-burst, long-context traffic:
# {'vllm:num_requests_running': 172.0,
#  'vllm:num_requests_waiting': 96.0,
#  'vllm:kv_cache_usage_perc': 0.957,
#  'vllm:num_preemptions_total': 4181.0}     # climbing ~18/min
Eighteen preemptions per minute against 7.1 requests per second is 4.2% of traffic, and that fraction is the reason this failure runs for weeks before anyone names it. A p95 is structurally blind to a problem confined to under 5% of requests, so the 95th percentile sits just below the affected set and does not move at all. p99 moves hard, from 25.3 to 33.8 seconds, since preemption selects the long-context requests and those already sit in the band between p95 and p99. The 8.5 seconds a preempted request spends waiting for its blocks is added to its end-to-end time and stays there; nothing about the 754 tokens it still owes dilutes it.
Better not to infer KV thrash from latency at all. Read
vllm:num_preemptions_total directly, alarm on its rate as a fraction of
arrivals, and treat vllm:kv_cache_usage_perc pinned near the ceiling as a
warning sign about admission.
The ceiling on speculative decoding
A draft model proposes γ tokens and the target verifies them in one pass. With independent acceptance probability α, the expected tokens per step is the Leviathan et al. (2023) result:
At α = 0.68 and γ = 4 that is 2.67 tokens per step, and what it costs depends on
which side of the crossover the verification lands. Verification widens the
target’s forward pass from one position per sequence to γ+1, so a batch of B
puts B(γ+1) positions in the step and reaches 183 at a running batch of 36.
The trap is to stop there and call 36 the gate. Speedup is a ratio of step costs, and past 36 the baseline step is climbing the compute side too, so both sides of the ratio grow and it decays gradually instead of falling off a cliff:
With a draft whose relative cost c is about 1/70 of the target, that gives
three regimes. Below 36 both sides are weight reads and speedup is a flat
2.67/(1 + 4/70) = 2.53x. Above 183 both sides are compute and the widening is
paid in full, 2.67/5.057 = 0.53x. Between them only the verification is
compute-bound, and break-even lands where the widening finally exceeds the
tokens it buys, at B = P(E − γc)/(γ+1) = 95.
The bound argument survives. E[tokens/step] is a sum of γ+1 terms each at most 1, so it can never exceed γ+1, while the compute-bound cost is γ+1 plus the draft, which means that once you are fully compute-bound, speculation loses at every acceptance rate: α = 0.90 gives 0.81x, α = 0.99 gives 0.97x. What is not true is that this starts at 36. Our base load runs a batch of 16 and our saturated load 64, which puts both operating points on the paying side, at 2.53x and 1.48x. Speculation is a win on this workload and the gate never fires, the opposite of what the batch-36 reading suggests.
That conclusion needs a correction, however, and it cuts against the pure-decode
framing this section has used throughout. Chunked prefill is on, so there are
almost no pure-decode steps here: at a batch of 64 the step carries roughly 324
prefill positions alongside its 64 decode positions, which is exactly why ITL sits
at 33 ms instead of the 14.3 ms floor. Speculation adds γB = 256 positions to a
step that already holds about 388, so the step widens by about two thirds rather
than by γ+1, and the prefill it displaces was work the scheduler owed anyway. The
real control on that step is --max-num-batched-tokens and not --max-num-seqs,
and the pure-decode roofline above is a worst case rather than a prediction.
There is a cost the roofline cannot see at all, and no page of the documentation raises it either. The draft model is co-located, loading into the same worker on the same TP group, before the profiling run that sizes the KV pool, so its weights come straight off that pool. Its attention layers then join the target’s in the cache spec, and since the block count is available memory divided by page size and by layer count, the draft also divides the pool across more layers. On top of both, a running sequence reserves up to 2γ+1 slots per decode step instead of one, because the proposed tokens are written into the target’s cache to be verified and the drafter needs lookahead slots of its own. Rejected tokens free nothing; the computed-token count rewinds and the slots are overwritten next step.
So enabling speculation moves the 180-sequence preemption point down three
separate ways, and no flag anywhere says so. The
page on conserving memory
does not mention speculative decoding, and the speculative decoding pages do not
mention memory, beyond running their examples at a lower
--gpu-memory-utilization than the default and not saying why.
The knob that used to express this is gone. disable_by_batch_size was removed
after it had been a no-op since V0, and the live replacement is
num_speculative_tokens_per_batch_size,
a schedule of [start, end, num_tokens] ranges. It is documented against the
Eagle family rather than against draft models, and it is disabled automatically
under data parallelism, so with a separate draft model the gate belongs in your
router, reading vllm:num_requests_running. One flag detail is worth stating:
always pass "method": "draft_model" explicitly, because when the method is
omitted vLLM infers it from the model name and a name containing eagle or
mtp will silently select a different algorithm.
Then check what that gauge counts before you gate on it. A request joins the
running list the moment its first prefill chunk is scheduled, long before it
starts producing tokens, so a request three chunks into a 3,944-token prompt is in
vllm:num_requests_running and has emitted nothing. On a mix that is 84% prefill
the gauge sits above the decode batch the widening argument is about, and furthest
above it exactly when long prompts are arriving. A router gating on it
turns speculation off during a long-prompt burst, which is the moment the decode
batch is small and speculation is worth the most. The metrics documentation calls
it the number of requests currently running, which is accurate but not what the
gate needs.
A load generator that can fail honestly
None of the above appears under uniform load, so the generator is the first thing to get right, and it has to make arrivals clump while lengths mix.
For arrivals, Gamma inter-arrival times with a coefficient of variation above 1 disperse requests within a window, but a Gamma renewal process has independent gaps and therefore no autocorrelation in its counting process, so it cannot produce the minutes-long clumping that multi-tenant traffic shows. The modulation between a base rate and a burst rate does that. What you are building is a two-state Markov-modulated Poisson process, and the Gamma part is the smaller half of it.
import asyncio, random, time, httpx

BASE_RATE, BURST_RATE, BURST = 4.0, 11.0, (60.0, 180.0)
PEAK_INFLIGHT = 530          # the backlog at the burst peak, plus the running batch

def sample_request():
    """70% short turns, 30% long context, mean 1,377 in / 272 out."""
    if random.random() < 0.70:
        n_in, n_out = random.lognormvariate(5.5, 0.5), random.lognormvariate(4.0, 0.6)
    else:
        n_in, n_out = random.lognormvariate(8.2, 0.4), random.lognormvariate(6.5, 0.5)
    return max(16, int(n_in)), max(8, int(n_out))

def interarrival(rate, cv=1.8):
    shape = 1.0 / cv ** 2
    return random.gammavariate(shape, 1.0 / (rate * shape))

async def fire(client, url, n_in, n_out, out):
    """The clock starts before the stream opens, so time spent waiting on a free
    connection lands inside TTFT. That is deliberate: a pool that is short of
    connections has to show up somewhere in the client's own numbers."""
    sent = time.perf_counter()
    ttft, last, itls = None, None, []
    async with client.stream("POST", url, json={"prompt": "x " * n_in,
                                                "max_tokens": n_out,
                                                "stream": True}) as r:
        async for line in r.aiter_lines():
            if not line.startswith("data: ") or line.endswith("[DONE]"):
                continue
            now = time.perf_counter()
            if ttft is None:
                ttft = now - sent
            else:
                itls.append(now - last)
            last = now
    out.append({"ttft": ttft, "itl": itls, "e2e": time.perf_counter() - sent})

async def run(url, duration=600.0):
    limits = httpx.Limits(max_connections=PEAK_INFLIGHT,
                          max_keepalive_connections=PEAK_INFLIGHT)
    out, pending, t = [], set(), 0.0
    async with httpx.AsyncClient(limits=limits,
                                 timeout=httpx.Timeout(None, connect=5.0)) as client:
        while t < duration:
            rate = BURST_RATE if BURST[0] <= t < BURST[1] else BASE_RATE
            gap = interarrival(rate)
            await asyncio.sleep(gap)
            t += gap
            task = asyncio.create_task(fire(client, url, *sample_request(), out))
            pending.add(task)                        # a bare create_task holds no
            task.add_done_callback(pending.discard)  # strong reference and can be
        await asyncio.gather(*pending, return_exceptions=True)   # collected mid-flight
    return out
Fire-and-forget arrivals are only half of an open-loop generator, because httpx caps concurrency in the connection pool underneath. Work out how much concurrency the experiment needs. The node serves 7.1 mixed requests per second, while offered load sits at 4 and jumps to 11 for two minutes, which puts arrivals above service rate, so the queue grows at 3.9 per second for the whole burst, 463 requests deep by the end. The last request to arrive waits 65 seconds for its first token, and the queue takes another 147 seconds to drain after arrivals fall back. A two-minute event puts the node over its TTFT target for four and a half minutes.
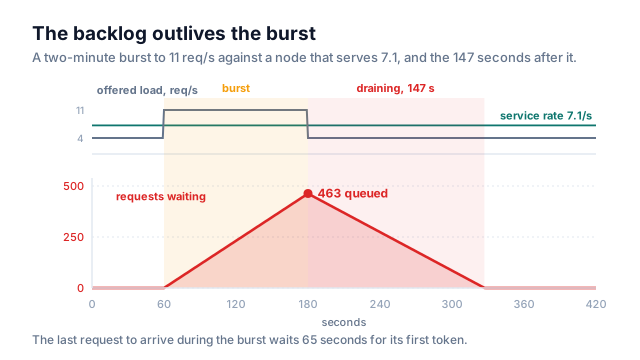
So the experiment needs roughly 530 requests in flight at the peak, and the httpx
default is max_connections=100, which is not merely low. Little’s law closes the
loop: with concurrency pinned at 100, throughput can be no more than what the
server completes, and latency settles at 100/7.1, or 14 seconds, so the generator
delivers exactly 7.1 requests per second, which is exactly service capacity. It is
open-loop in its structure but closed-loop in its transport.
The client’s own numbers do move, so this is catchable from the client side. What
is not catchable is the server side, because requests that never leave the
connection pool are requests the node never queued, so vllm:num_requests_waiting
stays flat, vllm:kv_cache_usage_perc never nears the ceiling and
vllm:num_preemptions_total never moves. Every finding in the preemption section
above disappears under a default pool, and it disappears in the shape of headroom.
The default read timeout does the rest. httpx times out at five seconds, and the
old fix of passing timeout=60 still censors every latency past a minute, which
here means the 65-second wait that is the entire finding. Pass
httpx.Timeout(None, connect=5.0) instead. It bounds the connect and leaves the
read open.
Where the money is
Now the configurations, priced off the same step model. Cost per request is
FLOPs · $/GPU-hour / (peak · MFU), and the GPU count cancels, so with a flat
price per GPU the ranking is decided entirely by achieved utilization.
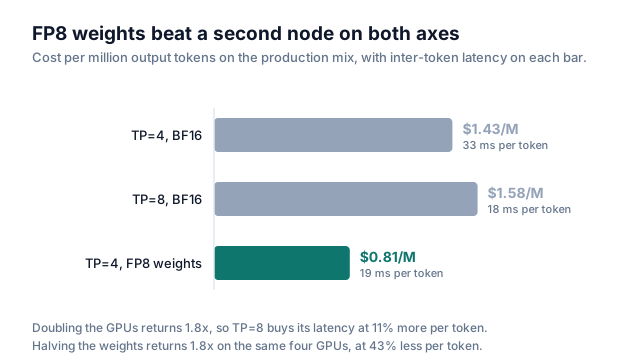
That cancellation decides the TP question before any measurement does. Tensor parallelism inserts two all-reduces per layer, 160 per forward pass on an 80-layer model, and no amount of overlap makes them free. So TP=8 returns something under 2x for exactly 2x the money, always: it cannot be cheaper per token than TP=4, only faster. We measure 1.81x, which prices TP=8 at 11% above TP=4 on the same mix, and the margin is the same on short and long shapes.
| Config | Output tok/s | ITL | $ / M output |
|---|---|---|---|
| TP=4, BF16 | 1,942 | 33 ms | 1.43 |
| TP=8, BF16 | 3,513 | 18 ms | 1.58 |
| TP=4, FP8 weights | 3,410 | 19 ms | 0.81 |
Three runs each at the saturated arrival rate, 10 minutes after a 3-minute warm start, medians reported. Speculation is absent on purpose: its end-to-end gain here depends on how much of each step is already prefill, which is a measurement rather than a derivation.
FP8 weights
are the largest single lever here, because halving the weights halves the bytes
moved per step, and because --quantization fp8 quantizes activations too, the
GEMMs land on FP8 tensor cores and the compute ceiling doubles as well.
Weight-only quantization gives you the first effect without the second, and on a
mix that is 84% prefill the second one is the one that pays: 1.76x cheaper per
token on the same four GPUs, at an inter-token latency of 19 ms against TP=8’s 18.
Buying the second node and quantizing the weights purchase the same latency, but
one of them costs 11% more per token while the other saves 43%.
The KV budget moves with it, and the symmetry is exact, since cutting the weight
shard from 35 GB to 17.5 GB leaves 52.1 GB per GPU for KV either way you get
there, so TP=4 with FP8 weights holds 271 long-context sequences against TP=4’s
180. Because the weight cut per GPU is fixed while the pool scales with GPU count,
TP=8 ends up with three times the KV headroom rather than the two you would budget
for. The cost is that FP8 weights change the model’s outputs and need their own
eval, and --kv-cache-dtype fp8 is doing heavy lifting in every number above: at
BF16 the KV cache doubles per token and the preemption point drops from 180
long-context sequences to 90.
Which makes the shipping config a set of numbers already derived:
vllm serve org/model-70b-instruct \
  --tensor-parallel-size 4 \
  --quantization fp8 \
  --kv-cache-dtype fp8 \
  --max-num-seqs 64 \
  --max-num-batched-tokens 2048
All of it is per process, and that is where deploys go wrong, because request
capacity pools across replicas while KV headroom does not. Take one node of four
out for a rolling restart and the survivors absorb its arrivals, but their pools
do not grow, so a routine deploy is what walks the fleet across its preemption
point. Boot time is on that path too, which is where the capture-size default
above comes back. The node that returns is the worst of the four. Its block pool
is process state, so it comes back empty and every request routed to it
re-prefills in full. Meanwhile /health returns 200 as soon
as the engine is up, and a balancer splitting evenly hands it a full share.
Nothing that endpoint reports means warm.
Draining it is worse. --shutdown-timeout defaults to 0, which aborts in-flight
requests instead of waiting for them, and a request at the p95 output length is
35.6 seconds of decode under load. So a default SIGTERM destroys long-context
requests preferentially, and those are the ones whose prefill costs the most to
redo.
What I would alarm on
Average utilization and mean throughput described none of the failures above. Four signals did.
The preemption counter is the only direct read on KV thrash, since the latency percentiles cannot see thrash until it is far worse than the point where you would want to know. Splitting TTFT from ITL tells you which resource a latency page is about, and queue depth predicts TTFT and nothing else, which makes it the right input to a load-shedding path. And the decode batch, which is not the running count, decides whether speculative decoding is helping right now.
The habit underneath all four is refusing to average across a mixture, because short and long-context requests are different workloads that happen to share a port, and a mean over them describes neither. That is also the limit of everything here: one model’s geometry, one price per GPU, one length mixture. The constants won’t survive the trip to your hardware even where the arithmetic does, so compute your own crossover first.